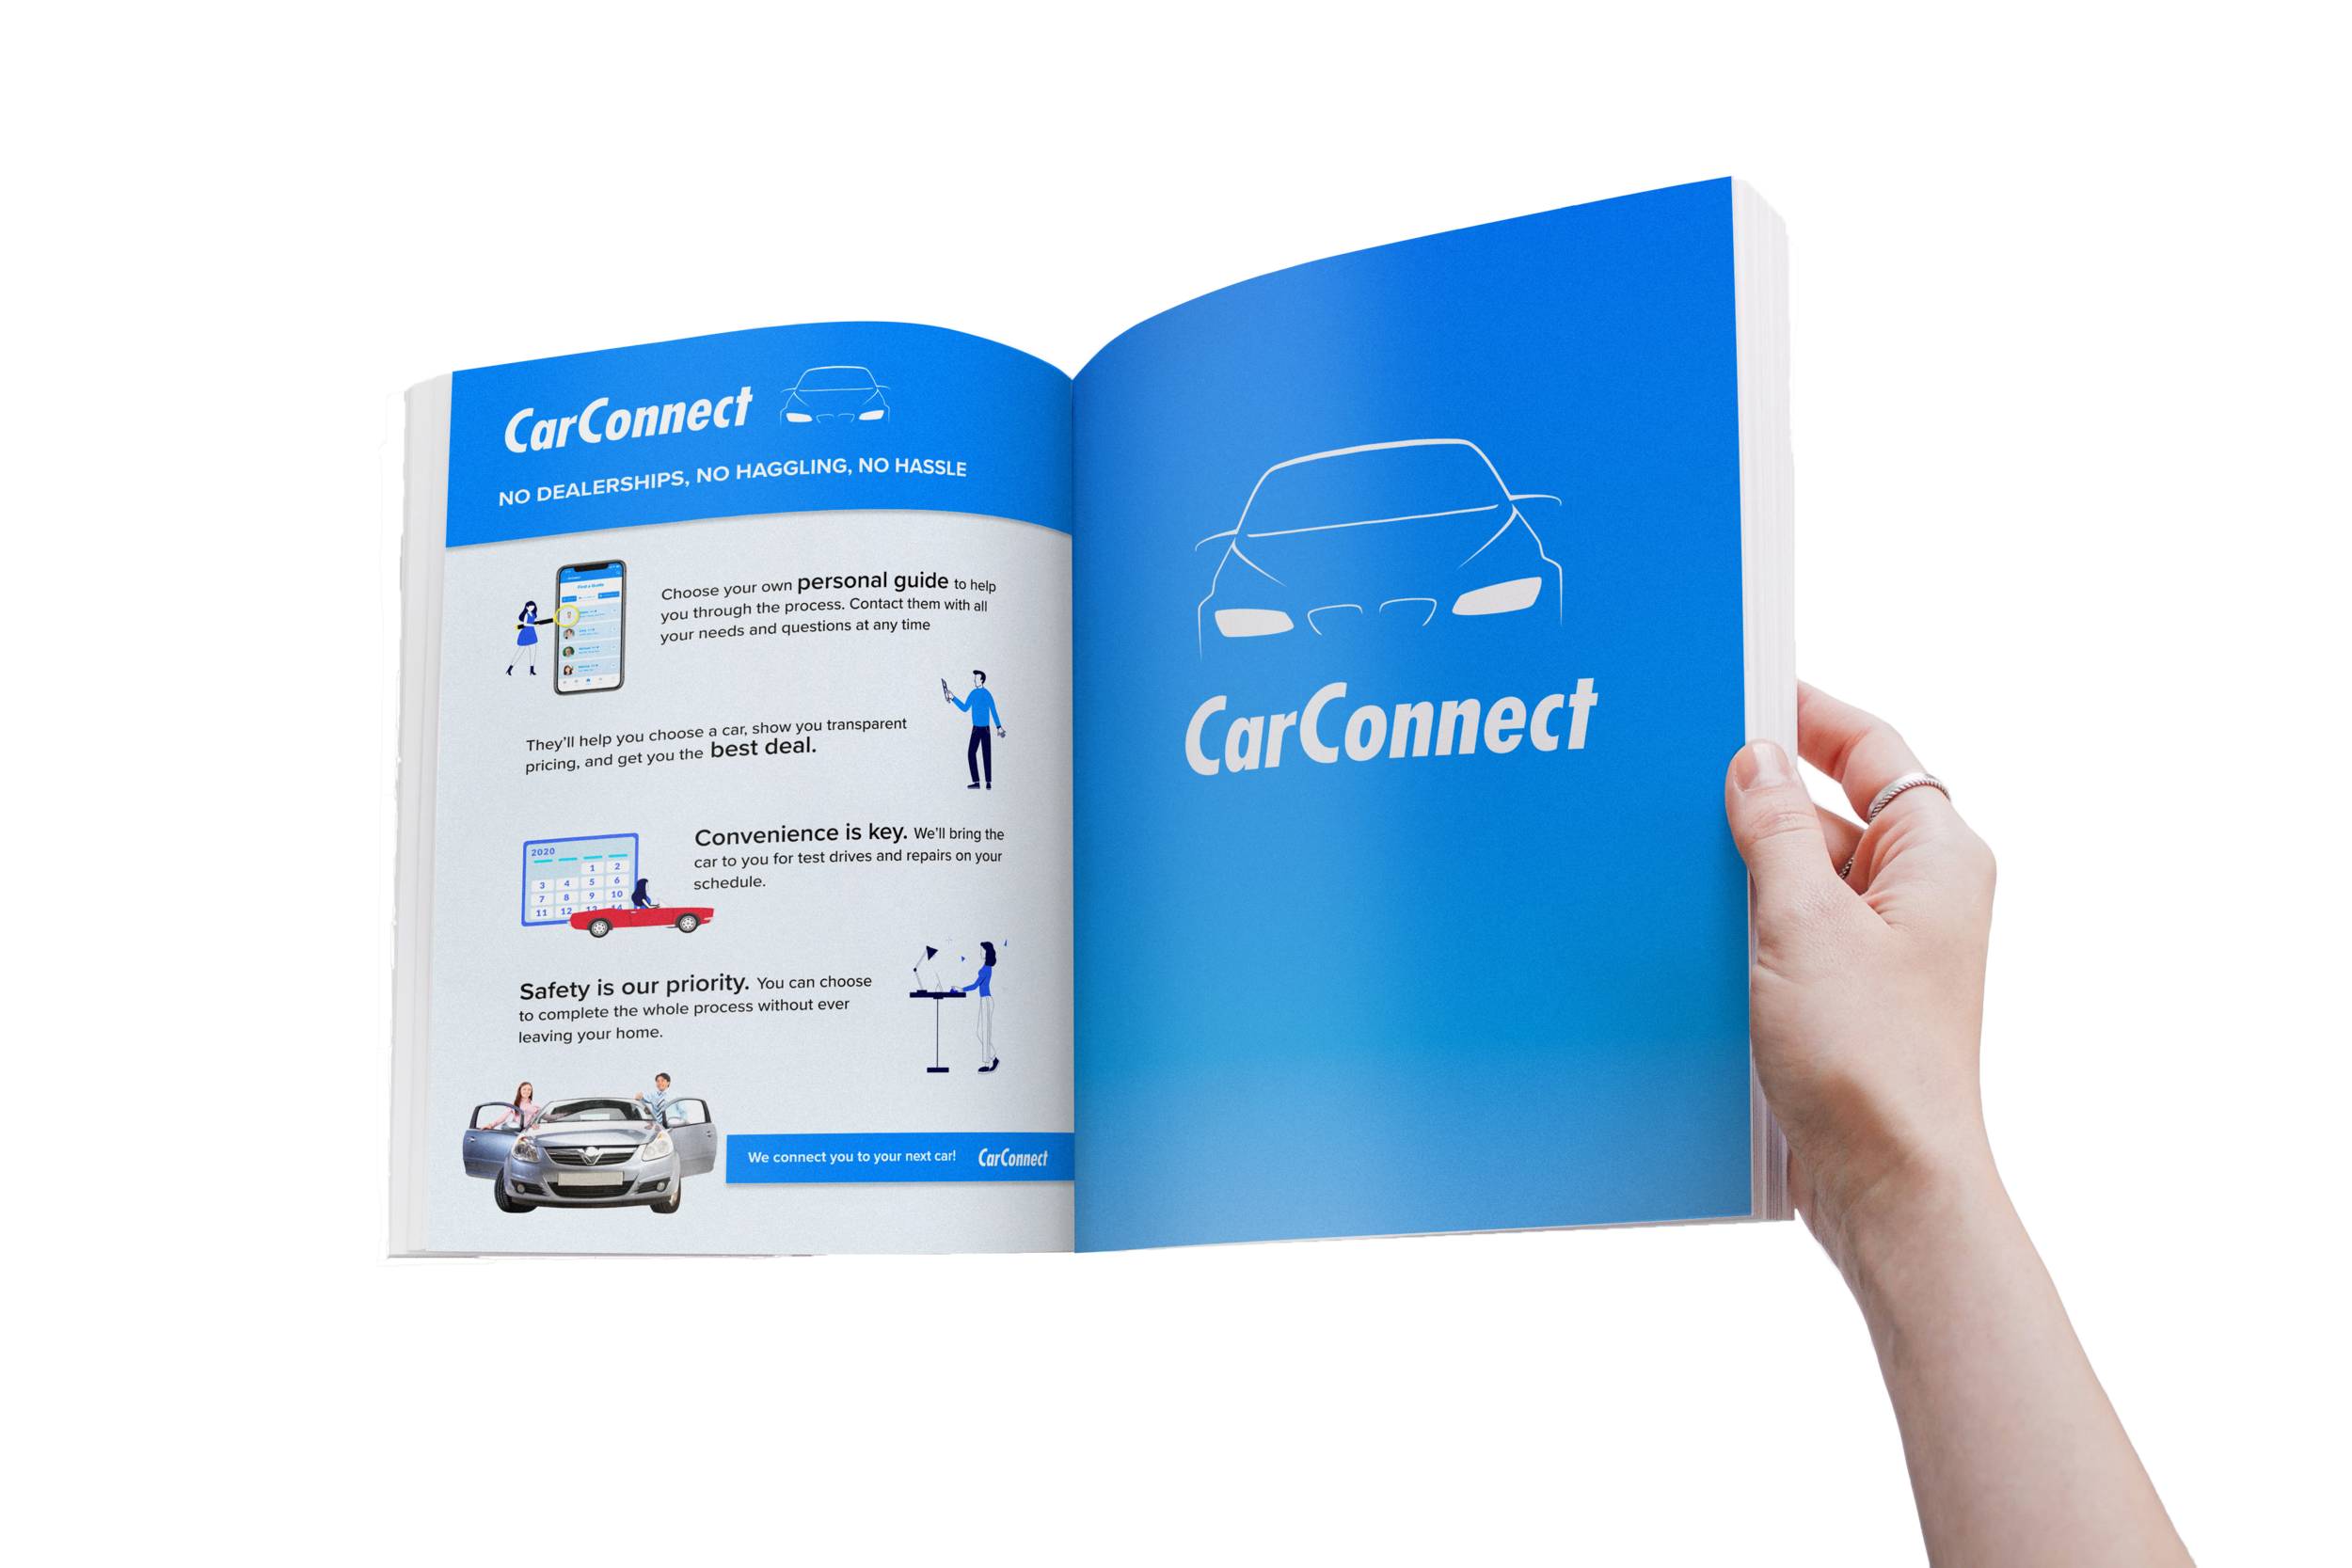
CarConnect
I worked remotely (due to COVID) with a team of three other UX students using a combination of different collaboration platforms (including Zoom and MURAL) to create a design solution for lack of trust in the auto industry. Carconnect is a seamless and convenient alternative to the dealership car buying experience. Carconnect revolutionizes the auto industry by allowing customers to purchase a car from the comfort of their home with the help of a personal guide who walks them through the process, finds them the best deals and brings test drives and repairs to their doorstep.
THE PROJECT
Our project was to research and explore the impact of the pandemic in the auto industry and what opportunities exist to redesign the experience to be more seamless and enjoyable for all stakeholders during COVID and beyond. I was part of a team of three tasked with managing our own skills/strengths to create a design solution.


EMPATHIZE
PANDEMIC ERA CAR BUYERS ARE CONFUSED AND UNCERTAIN. WITH SO MANY MIXED MESSAGES AND UNCERTAINTY RE: THE FUTURE, IT’S DIFFICULT TO DECIDE WHETHER BUYING A CAR AT THIS TIME IS A GOOD/BAD IDEA….
We began the project by empathizing with stakeholders. We built an empathy map to visualize what different stakeholders feel, see, do, think and feel AND their pain vs. gain while buying a car or working in the auto industry during the pandemic.

NARROWING SCOPE AND DEFINING THE PROBLEM
THE PANDEMIC EXACERBATED AN EXISTING PROBLEM IN THE INDUSTRY: CONSUMERS DON’T TRUST ANYONE SELLING (OR FIXING) CARS
Based on our empathy exercises we did a brainstorming sprint designed to narrow the scope of our research. We used ‘brain-writing’ to quickly ideate on different HMWs related to some of the pain points we uncovered during empathy mapping. We then organized our HMWs into 5 major categories and quick voted on which were the most important to investigate further. The 5 categories were:
1. Transparency and trust
2. Efficiency
3. Personalization
4. Safety and Comfort
5. Profitability
We then prioritized our opportunity areas by importance and feasibility and used the highest scoring on both categories to ideate towards our problem statement.
We also examined our HMWs and problem statements and identified some of our key assumptions. We placed these assumptions on a grid organized by risk and uncertainty in order to keep our assumptions in check and to identify our riskiest assumptions and keep them in mind while creating our hypothesis and planning our next steps.
The user need statement we planned to focus on going into pre-research was:
As a customer buying a car, I want to have consistent transparency throughout the experience because I need to feel safe + comfortable enough to trust this company with such a big purchase.
NARROWING SCOPE AND DEFINING THE PROBLEM
THE TRUST GAP IN THE AUTO INDUSTRY HAS LEAD TO A CONSUMER RELIANCE ON THIRD PARTY SITES AND CUSTOMER REVIEWS
Before diving into prep-research, we prepared the following outline for our team:
PART 1: Defining trust and transparency in the auto industry
PART 2: Companies that have developed brand loyalty and consumer trust (outside the auto industry)
PART 3: COVID’s broader impact on society
PART 4: Car dealerships current policies
PART 5: COVID’s impact on the auto industry
Armed with our empathy exercises, pre-research scope and problem statement, we split tasks and diverged to collect data.
We organized our research in a mind map to help visualize our findings.
We each presented our findings to the team and we narrowed our research down into 5 important key takeaways:
There is a trust gap between customers, dealers and repair shops, created (in part) by poor offline and online integration. Because of this gap customers are seeking info from 3rd party sites and customer reviews to make decisions.
Companies that have developed consumer trust and brand loyalty are reliable and have consistent personalization, accountability, transparency and excellent responsiveness.
COVID is having a huge impact on the economy, and is changing people’s buying and transit habits, but perhaps not as much as anticipated.
Higher end dealerships are minimizing the impact COVID has made on their business. Mid-range dealerships are emphasizing safety changes and a new, simplified online buying experience.
The impact on the industry will be twofold–the shift towards omnichannel car buying is expedited, and the huge drop in car sales will affect future R&D, which could have an impact on EV production
We revisited our problem statement at this stage to include details from our key takeaways and re-phrase the problem with a solution oriented lens:
We believe that creating transparency in pricing and offline/online integration throughout the customer experience at a mid-range dealership will give customers a sense of comfort, safety and reliability creating brand loyalty and consumer trust.
MOVING BEYOND ASSUMPTIONS: THE RESEARCH PHASE
PHASE 1: DEFINE
We began our research phase by defining our research scope. We planned to do confirmatory research to confirm the problem of lack of trust in the auto industry, the problem of poor offline/online integration and the fact that customers want transparency as a solution. We planned exploratory research to identify additional details on the source of the trust issue in the auto industry, other potential solutions, and further pain points experienced by stakeholders.
We also identified our research questions, assumptions and goals.
PHASE 2: PREPARE
To begin our research planning, we performed desk research to on the subject matter to get an overview of what has been uncovered in this field by others. We then defined frameworks, samples, methods and context for our research. We planned to perform method, data and researcher triangulation by using varying methods, data outputs and researchers to record the same phenomenon in order to improve the accuracy and richness of our research and minimize potential bias.
PHASE 3: RESULTS
We performed in-depth and contextual interviews of 4 dealership employees: 2 sales reps, 1 service manager, 2 car buyers and 2 leasers and 1 car owner going through the repair process. We organized our raw interview data on a shared MURAL board:
We also did participant observations of 2 employees and 1 customer going through the repair process. We performed an auto ethnography to map the customer experience through the dealership journey and we performed an online ethnography analyzing data from car dealership facebook groups in the LA area.
We consolidated our data on the following research wall and converged to work together to group important findings and identify patterns.
WHO ARE OUR USERS?
IN OUR DIGITIZED WORLD WHERE SERVICES + INFO ARE EASILY ACCESSIBLE BUT INFORMATION OVERLOAD IS A PAIN PONT, OUR BUYERS WANT CONVENIENCE, TRUST AND CERTAINTY.
Using our triangulated research and data we came together and identified common patterns and insights and used those details to create our key stakeholder personas:
Using all facets of our research, we mapped the current state user journey, allowing us to visualize low and high points in the existing experience to augment and solve for.
Finally, we listed out the full list of stakeholders, and mapped them according to their direct and indirect influence on the car buyer.
ANALYZING OUR FINDINGS
LOW POINTS IN THE CUSTOMER JOURNEY ARE TIME CONSUMING PRE-RESEARCH, POOR COMMUNICATION, MISINFORMATION, HAGGLING AND LONG HOURS AT THE DEALERSHIP.
To prep for ideation we first diverged to review our research wall and created key insights, JTBDs, and user stories based on research. Then we converged to identify patterns and group our findings by opportunity areas. Finally, we voted to identify our top 8 areas of opportunity.
We then used those opportunity areas to create HMWs to stimulate ideation and creativity. We placed our HMWs on a broad to narrow scale in order to filter out solution oriented ones because we wanted to have a broad HMW as our starting point to prevent from solving too early.
We then voted on the top HMW within each top insight/opportunity area.
We further narrowed at this stage by selecting our top three HMWs to guide our first ideation sprint.
IDEATING POTENTIAL SOLUTIONS
SOLVING FOR LACK OF TRUST IN A PANDEMIC
We did a series of design sprints to ideate on our top opportunity areas. As we were ideating during the pandemic, we swapped pen and paper for MURAL - an online collaboration software allowing us to work visually while on zoom. We did a series of Crazy 8 exercises and ideated based on current and future state journey maps. We then voted on our top ideas to ideate in more depth using solution sketching.
We then ranked our top ideas by feasibility vs. impact on customer experience. We discussed each idea in context of our future state journey map and selected the most high impact yet feasible ideas to use moving into the prototyping phase.
PROTOTYPING
ARE OUR IDEAS SOLVING THE RIGHT PROBLEM? ARE THEY FEASIBLE? AESTHETICALLY PLEASING? WHERE DO BUGS/ISSUES LIE?
PROTOTYPING VALUE
We tested our service advertisement with 5 different users that fit our target persona. We found that 100% of our customers found value in this service. Users found the most value in having a personal guide get them the best deal. This reflected our research in that haggling is the number one pain point experienced by customers.
In order to start hashing out the details of the customer journey, we started with a team investigative rehearsal, rehearsing digital services and digging into subtext. Our goal was to get a shared understanding within our team of the end to end experience and clarify the emotional side of the experience. We conducted our rehearsal via zoom and designated one team member to facilitate and add to our shared MURAL board journey map.
PROTOTYPING FEASIBILITY At this stage we also began prototyping a shared business model canvas to document feasibility ideas, bugs, and actionable insights.
PROTOTYPING LOOK AND FEEL We also worked together to create a shared ‘look and feel’ mood-board. We chose to focus on the color blue, as it’s psychologically proven to convey feelings of solid, confident, reliable (2).
PROTOTYPING PHYSICAL OBJECTS + EXPERIENCES (AND SOME DIGITAL SERVICES + ARTIFACTS)
We used a variety of different prototyping methods to nail down the physical experience of our service. We cycled between investigative rehearsals, rehearsing digital services, desktop walkthroughs, exploring subtext and building cardboard prototypes.
PROTOTYPING DIGITAL ARTIFACTS AND SOFTWARE
To prototype the more digital areas of our service we started with sketching and click through prototyping and then moved on to wire-framing and more high fidelity prototypes.
We recorded bugs, feature ideas, questions and actionable insights on a MURAL prototyping wall, and created more detailed journey maps and service blueprints for various stages of the journey.
After many iterations of prototyping, we landed on a high fidelity version we were ready to test more formally with usability testing.
USABILITY TESTING
Going into usability testing our main goals were to identify inconsistencies and usability issues in content and design, gather data on the quantitative and qualitative user experience, and establish baseline user performance and user-satisfaction levels of the user interface for future usability evaluations with post-task completion survey.
We conducted testing with researcher and data triangulation, a diverse range of participants and a diverse range of scenarios in order to minimize bias and collect accurate results.
We collected data at each stage of the journey and recored it in the following google sheet. Our highest satisfaction rates were during the find a guide (95%) and repair phase (95%) of the journey. Our highest CSAT scores were during the repair (85%) and schedule a test drive phase of the journey (90%). Our top task error rate occurred while booking a mechanic and initiating purchase after test drive.
Our next few rounds of iteration including ideating exercises based on usability testing metrics and continued testing to hone our product and service journey.


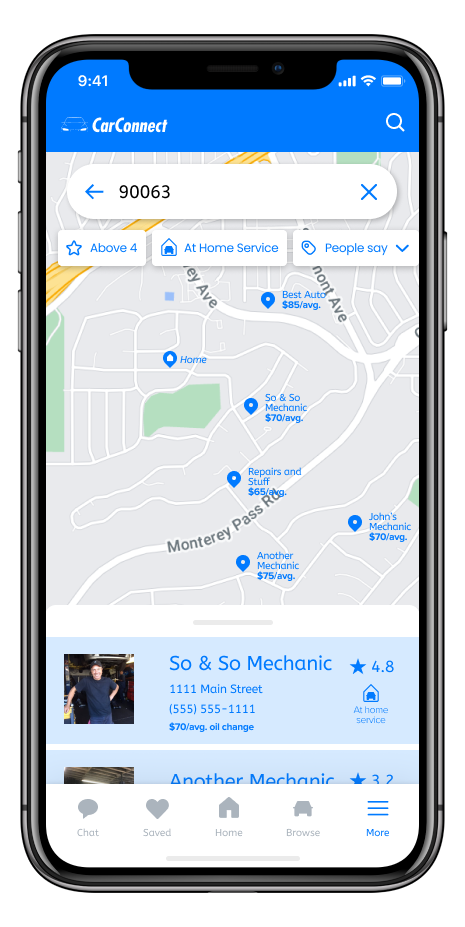
FINDING A PERSONAL GUIDE
To solve for the lack of trust between customers and salespeople, we reimagined the role of the salesperson as a ‘personal guide.’ To give customers a sense of agency and control that is often lacking in the car buying process, we designed an experience where they can select their own personal guide based on various factors including customer reviews (a big ‘trust-builder’ based on our research).
After feasibility research and user testing we added guide specialties as a search and filter option, allowing customers to find experts on specific make/models.
This phase had an 85 % satisfaction (CSAT) and a 95% ease of use score after our final iteration.
CHOOSING A CAR TO TEST DRIVE
Due to issues in clarity and lack of personalization between the salesperson and customer that arose while searching for a car, we implemented a pre-contact survey for customers still looking for a car at this stage. After an 80% error rate in the user testing at this stage while customers were completing the survey, we added a ‘skip, I have a car in mind’ option.
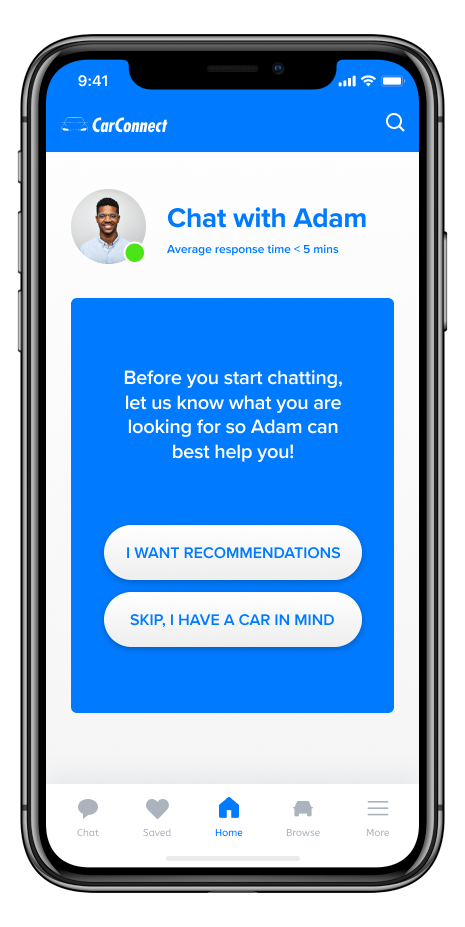

THE SURVEY:
Within the survey, the user is able to identify their various preferences in certain categories as well as providing a target price. The user also has the option to skip over sections and have the guide give broader car recommendations instead. The survey provides the guide with important information in order to recommend cars that best fit the person’s lifestyle and budget.
CHAT:
Once the guide receives the customer preferences, they will send car information via chat. They will provide transparent price estimates, a percentage score that shows how closely the car matches with the customers preferences, and an information document explaining the car and its features. The chat function is also equipped with pre-generated message options which allow for fast & effective communication between customer and guide


SCHEDULING THE TEST DRIVE:
Once the customer has decided on a car they wish to test drive, their guide sends them a response form where they have options to choose between a contactless test drive or test drive with their guide as well as between a short test or an extended 24 hour option. Then, the customer is asked to pick a date, time, and convenient location for their test drive.
The contactless test drive is a big value prop of our service, based in part on our research given that 60% of car buyers valued convenience and were willing to pay more for it (especially during the pandemic).

SECURE DETAILS
Next, customers are asked to upload secure information like their drivers license and credit card to secure their booking. Here, we made sure to provide secure forms and transparent policy information in our later design iterations based on feedback from user testing in the payment phase of the journey. After iterating to make this upload process feel more secure, our initial satisfaction score of 85% increased to 90%.
PAYMENT
Our guided payment process is seamless, convenience and can be done 100% digitally. Customers use an interactive/transparent loan guide to help them decide on terms. Their guide helps them choose the right loan plan for them and they can ask questions throughout the process. Customers are also able to sign secure forms online using their finger.


THE CONTACTLESS TEST DRIVE
Customers who choose to ride solo for 25 hours will receive an e-key upon vehicle drop-off. A digital voice assistant will be available during their drive to review features and answer questions. This experience went through many iterations finally landing on an experience that was feasible for the business and safe + enjoyable for the customer.
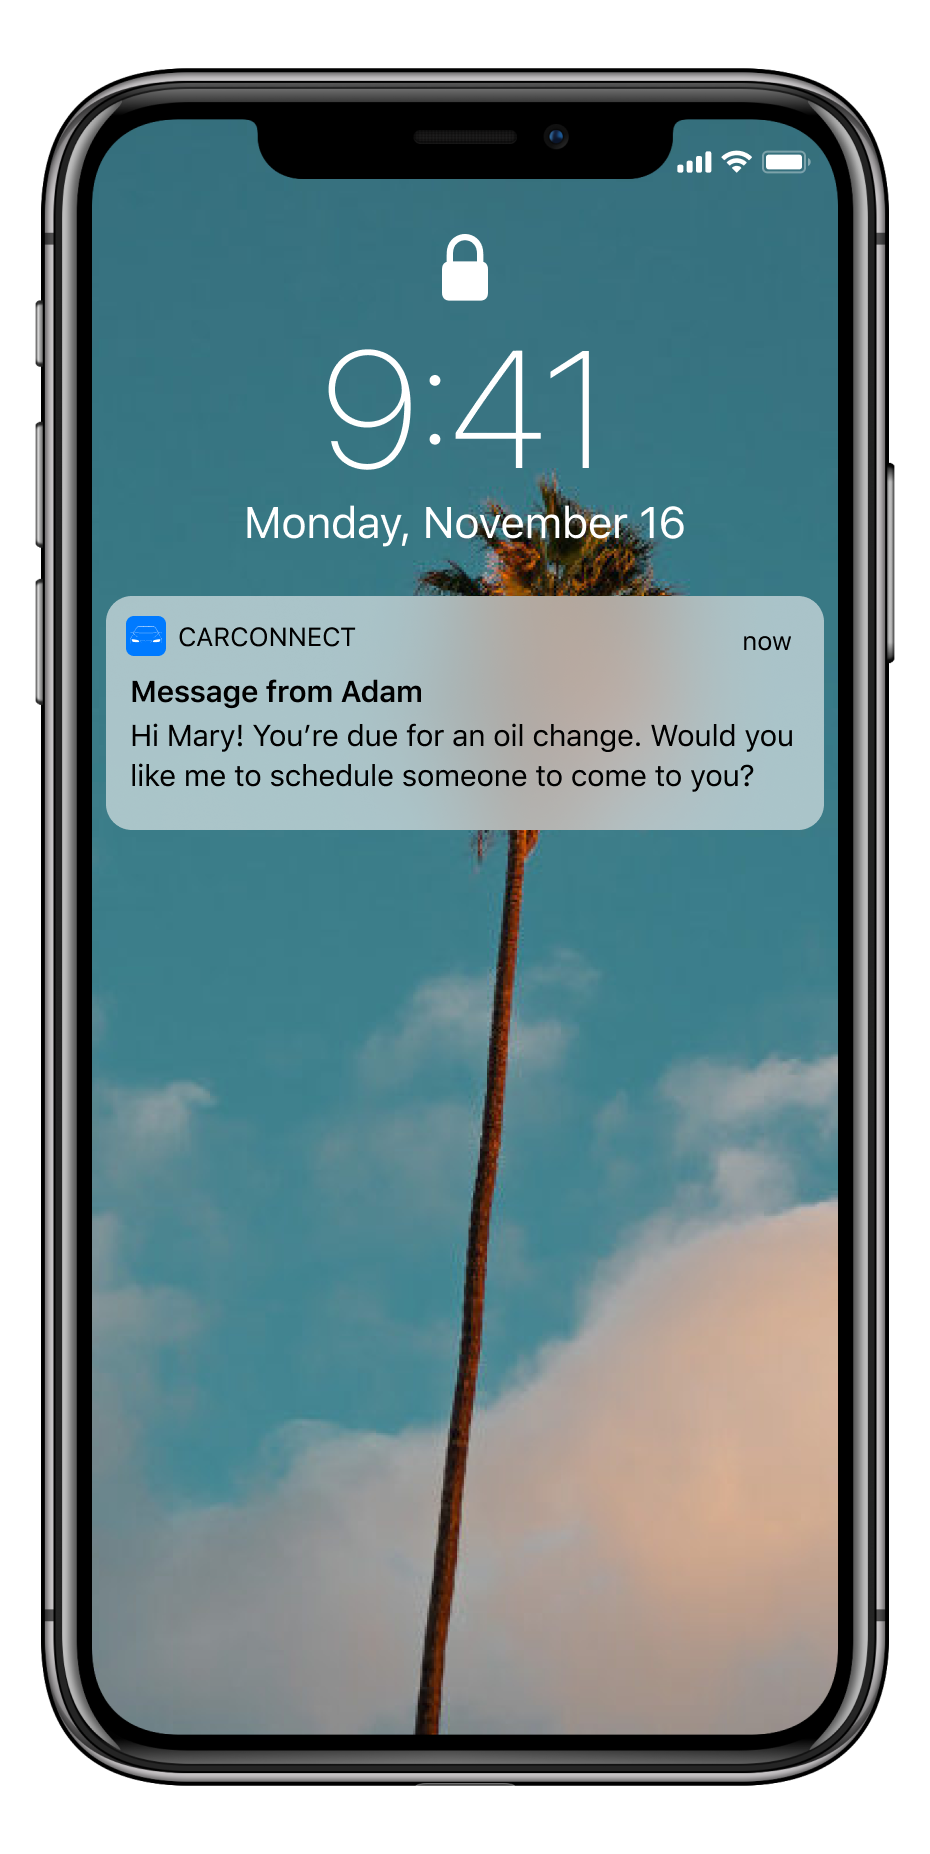
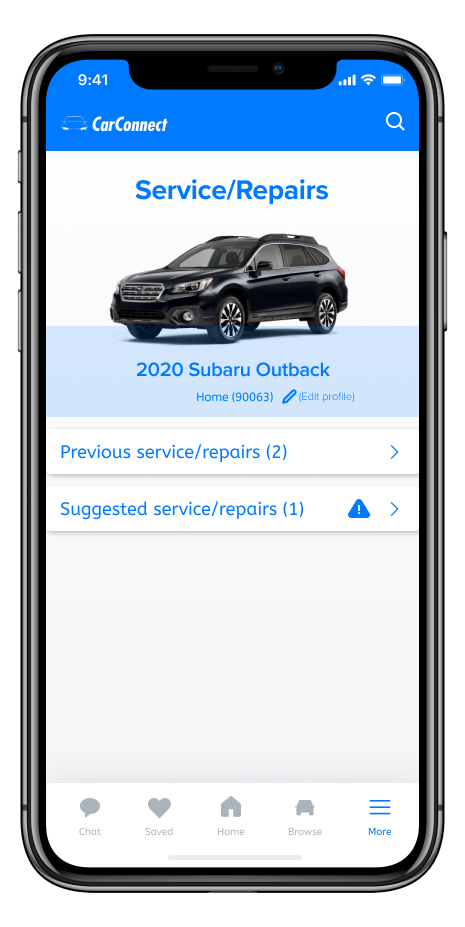
REPAIRS
The app syncs to your cars vehicle maintenance system and updates you when the car is due for a repair. Carconnect allows you schedule at-home repair services.